Analytics are at the heart of every move you make as a podcaster.
Without having a good grasp of your numbers, you’ll never know if you’re meeting your podcasting goals, if your downloads are increasing or what you need to do to grow your listener numbers.
Measurements like unique listens, downloads, popular episodes, listener behaviour and demographics help you to make intelligent, data-based decisions which you can then apply to your podcast marketing or growth strategy. Analytics can also give you guidance on what kind of episodes and content to produce, as well as valuable data to help attract or pitch to sponsors.
So how can you interpret your podcast analytics and put them to work?
In this guide, we’ll help you understand all of the elements you’ll find in the Captivate dashboard and how you can use them to inform your ongoing podcast launch, growth and marketing efforts!
In this article:
What Are Podcast Analytics and How Are They Measured?
Podcast analytics refers to the representation of your podcast’s performance data.
You can get analytics from a number of different places, like the Google Podcast Manager, Apple and Spotify dashboards and of course, your podcast host.
The problem is that podcast analytics are yet to be fully standardized across the board, meaning that measurements like download and listener numbers can still vary from place to place. This causes a bit of a headache when trying to get an accurate picture of how your podcast is really performing, especially when you’re new to the game.
Enter IAB Certification: Reliable, Accurate Industry Standard Podcast Analytics
IAB certification ensures that podcast analytics meet the industry standards. This basically means that all metrics (so downloads, listens etc) are, in IAB’s own words, “consistently defined and measured equally … to reduce measurement discrepancies”.
In other words, you can rely on IAB Certified podcast analytics to paint a true, accurate and reliable picture of your podcast’s stats and performance data based on industry best practices.
Captivate is IAB Certified and has been designed to give you powerful, advanced insights to your download numbers, all presented in one central easy-to-understand dashboard.
Captivate analytics bring together download data from all sources to give you a true picture of how your podcast is performing, without the need to run manual reports yourself.
Pro tip: Want more insight on what counts as an IAB Certified download, and how downloads get collected? Listen to Captivate CEO and CTO Mark and Kieran straighten out the subject:
How Do You Measure The Success Of A Podcast?
When you first publish an episode or launch a podcast, watching those download totals climb is really, really rewarding after all of your hard work.

Some of the biggest questions we get asked are “How many downloads should I be getting?” or, “How do you know if a podcast is successful?”
The answers are as mysterious as the Holy Grail. The long and short of it is that ‘successful’ podcast download numbers can be in the thousands or the hundreds. It all depends on a range of factors, like your goals for running the podcast, your audience and your chosen topic.
What is a good number of downloads for a podcast?
To throw out some numbers, the average podcast episode gets just over 100 downloads over a 30 day period.
Our podcast, Captivate Insider, averages 390 downloads a month. An extreme example would be Joe Rogan’s podcast, which gets over 190 million downloads in that same period.
Two completely different sides of the same coin, but nonetheless successful, because they each serve a purpose for their respective audiences.
It’s important to understand that podcasts are consumed completely differently to other forms of content. Unlike hitting the like button on a tweet, potential listeners take several steps before downloading your podcast and subscribing. Your goal is to serve your audience, forge connections with your listeners and build a strong community around your chosen topic. That’s how you’ll grow and that’s how you’ll measure success.
So podcast downloads, whilst being a useful tool to measure growth, peaks and troughs over time, shouldn’t be interpreted as the beginning and the end of podcast success.
How Do You Find Podcast Analytics?
You can find podcast analytics in lots of different places, but to get a strong and reliable picture of how your show is performing, it’s best to head to your podcast hosting platform.
Hosts like Captivate bring together analytics from multiple sources into one simple dashboard, so you can easily and accurately measure key metrics at a glance.
If you want to access your analytics individually, you’ll need to verify your podcast with the separate providers. You usually do this by grabbing your RSS feed URL from Captivate and verifying your information via email or text.
Pro tip: Captivate works with the major directories on direct ingestion and passthrough. Drill down the source of your podcast downloads by Apple, Google, Spotify etc, directly within your analytics dashboard!
Another article we think you’d like...
Reading Time: 7 minutes It’s a crucial step in starting a podcast, so how do you come up with your podcast name? Learn how 5 podcasters came up with their names along with everything you need to know about choosing your own.
How to use Podcast Connect to get Apple Podcasts analytics
If you’re curious about how your podcast performs exclusively within the Apple Podcasts app, you can find out by using Podcasts Connect.
Just sign in with the Apple ID you used to submit your podcast to access Apple-only analytics, like:
- Total listening time per episode
- Proportion of subscribers/non-subscribers who listened to a particular episode
- Audience retention per episode
Where to find Google Podcasts analytics
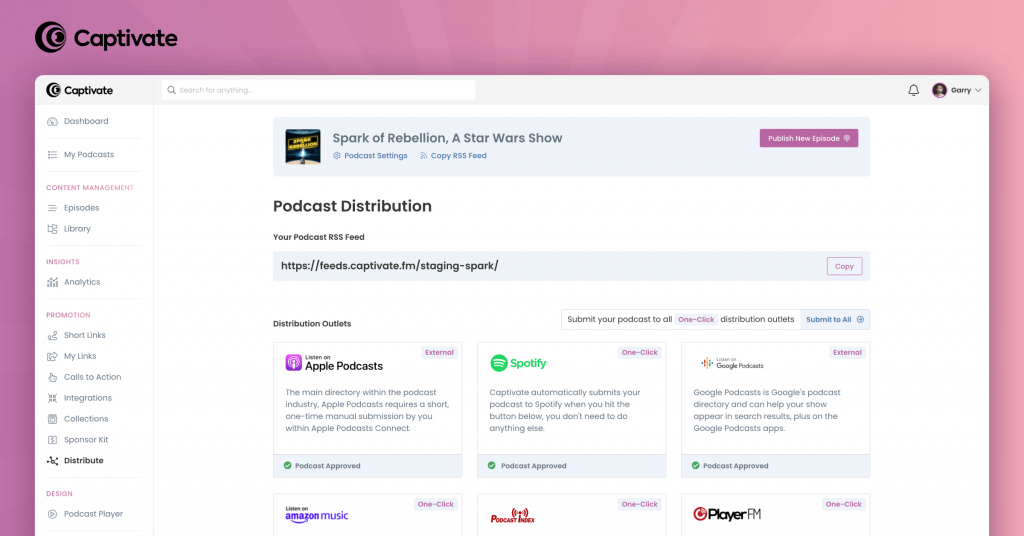
You can submit to Google Podcasts Manager directly from the Captivate dashboard. You only need to do it once, then you’ll be able access Google’s podcast analytics or ‘podcast reports’ any time you like, from the Google Podcasts Manager dashboard.
Google’s analytics suite provides data on:
- Episode/total play count
- Plays within the first 30 days
- Audience retention per episode
Where to find Spotify podcast analytics
Like Google, you can submit to Spotify within the Captivate dashboard in just one click. You can access native Spotify analytics through Spotify for Podcasters, but you’ll need to verify your podcast separately using the Spotify account linked to your podcast RSS feed.
You’ll be able to view data on:
- How many followers your Spotify podcast page has
- Your ‘starts’ (how many people have clicked ‘play’ on an episode)
- Your ‘streams’ (how many people have listened to 60+ seconds of an episode)
How to Access Your Advanced Podcast Analytics with Captivate
Captivate offers powerful, advanced podcast analytics as standard to every podcaster from day one. To access your podcast analytics within Captivate,
- Click Analytics from the main left-side navigation; or
- Click All Analytics from the main podcasting dashboard
The Captivate podcast analytics dashboard is divided up into 6 key areas, each giving a snapshot of a certain metric. But what do they all mean and how can you interpret them, meaningfully, to help drive your podcast’s growth?
Let’s get into it!
How to Measure Your Audience Engagement with Podcast Analytics
Unique Listeners
Use this for: knowing your true audience size
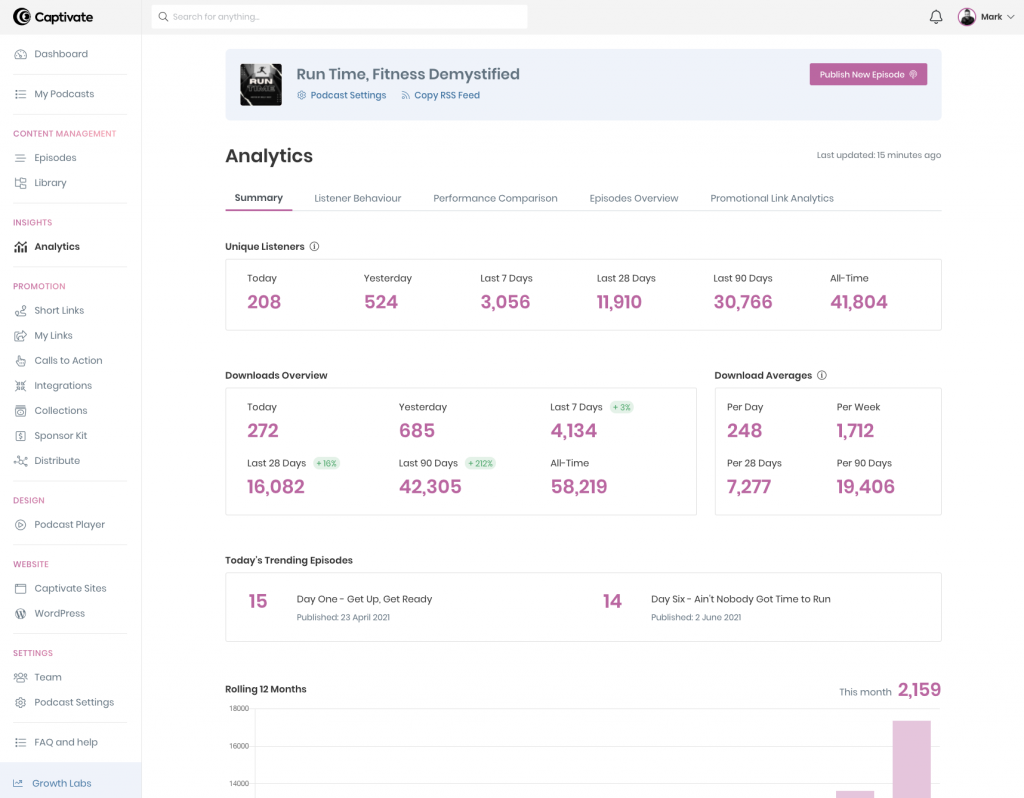
A Unique Listener is defined by the IAB as a listener with the same IP address and the same device within a certain timeframe. It’s 100% anonymous and is a great way of estimating how many individual people your show is reaching.
But why, exactly?
Together with your downloads, unique listeners are a powerful metric used to determine your true audience size.
As opposed to downloads, which takes into account whenever an episode is downloaded, the unique listener metric ignores multiple downloads by the same person. So, if one person downloads one episode 6 times, it would count as one unique listener.
Why is this useful?
Keeping track of your unique listeners is incredibly useful for recognising engagement rates as well as charting growth over time. If, for example, your unique listeners for the past 7 days are 600, and your total downloads for the same time period are 3000, you can safely say that your listeners are downloading more than one episode at a time or are consuming your episodes over multiple sessions.
Captivate provides data on your unique listeners across 6 different timeframes, so you can be as granular or as general as you’d like.
- Same day
- Previous day
- Per 7, 28 and 90 days
- All time
Number of downloads and downloads overview
Use this for: measuring the popularity of your show and content
Whilst total downloads will give you an inflated estimate of your audience size (use Unique Listeners to get a more accurate picture), your downloads are nonetheless a really useful gauge of the popularity of your podcast.
This is because a download doesn’t necessarily mean a genuine listen. It’s more like an indication of intent. How many times have you downloaded a bunch of podcast episodes to listen to on a long car journey, only to fall asleep the whole way? You liked the show enough to download, and had every intention of listening, so you hit download.
That might not be a concrete unique listener you can take straight to the sponsors, but it’s still a useful metric to pay attention to – especially when used in conjunction with other data. If, for example, unique listeners are going up as well as your downloads, you’re onto a winner.
In Captivate, the number of downloads refers to the total number of people who downloaded episodes of your podcast over a given timeframe.
Another article we think you’d like...
Reading Time: 6 minutes Your podcast description is often the driving force behind deciding to listen in for the first time. Here’s our blueprint for how to create a persuasive, effective show summary that converts browsers into fans!
You can see a ‘Downloads Overview’, which gives you a quick snapshot of the most useful download statistics at a glance, and a ‘Downloads Average’, which gives you an average based on your show’s analytics since launch.
You can also drill down into specific episodes and get a full dashboard of episode-level stats, including trends, web player analytics, demographics and downloads.
So for example, if you’ve invited a new guest on for an episode, you can measure how much traffic that guest brought to your podcast, as well as useful insights on who your new listeners are!
Today’s Trending Episodes
Use this for: keeping track of new releases and popular episodes on a given day
When you release a new episode, you want to see how well it’s being received as quickly as possible. You might also see a spike in downloads and wonder where that influx of attention has come from!
Captivate gives you the stats for your trending podcast episodes on the day you log in. You’ll be able to see how many downloads those episodes have received easily and at a glance, making it easier to notice and identify spikes and heavy traffic days as they happen.
Your top-performing episodes are also a good indication of what your listeners are enjoying most, helping you to measure the success of your marketing and make future content decisions.
Rolling 12 Months
Use this for: getting a top-level view of your total downloads month-by-month over 12 months
It’s easy to obsess over details when looking at your podcast stats. It’s extremely useful, too. But what about zooming out to see the bigger picture? Wouldn’t it be good to look back and see the results of your hard work podcasting month by month?
This feature shows your podcast’s total downloads for all episodes month by month, allowing you to see a top-level view of your listeners’ behaviour over the past year.
If you’ve ever looked at your podcast’s stats and not known where to even begin, this view is for you. With this chart, you can easily identify spikes, troughs and trends and use them to kickstart deeper insights into your listeners’ behaviour, top-performing episodes and marketing activity.
How to Interpret Listener Behaviour with Podcast Analytics
Web Player Analytics
Use this for: measuring consumption and listener duration through the Captivate web player
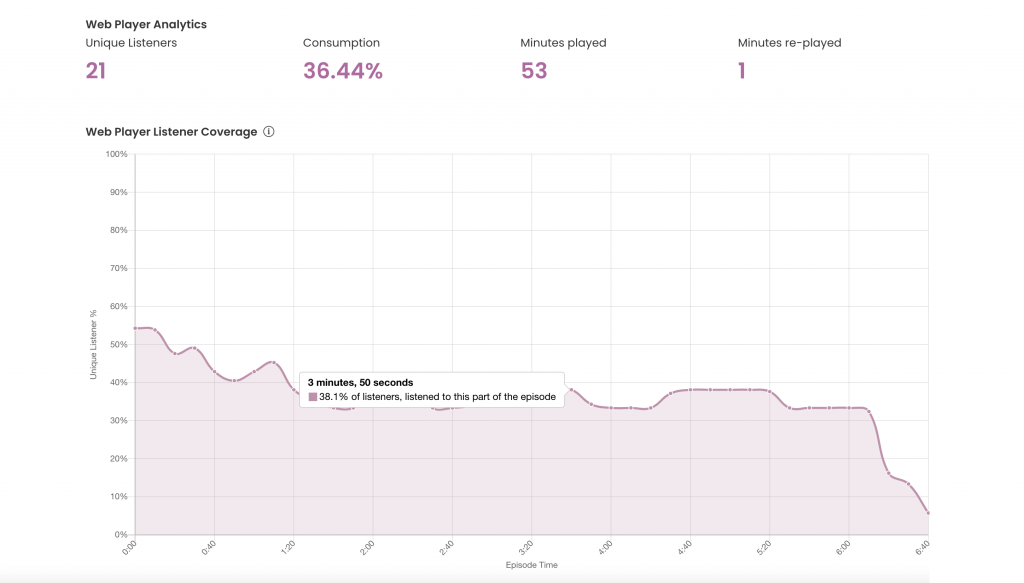
Listeners don’t just find new podcasts through apps and directories. In fact, word of mouth, social media and websites still play a huge role in podcast discoverability, so it’s important that your episodes are just as available and accessible online as they are on a device. That’s why we provide beautiful, functional web players free to all Captivate podcasters.
Web players are important, yes, but just as important is the ability to know who is using them, how they listen and how the player stacks up to the directories in terms of overall consumption.
With Web Player Analytics, you can see:
- How many unique listeners hit play on an episode
- How many people are choosing your web player over listening apps
- Listener duration, drop-offs and replays
With these powerful stats, you know where to channel your marketing efforts, where to put your sponsorship reads, calls-to-action, guest spots and how to format your podcast to best engage your listeners and grow your downloads!
Daily Trends
Use this for: knowing when your listeners are most active and engaged
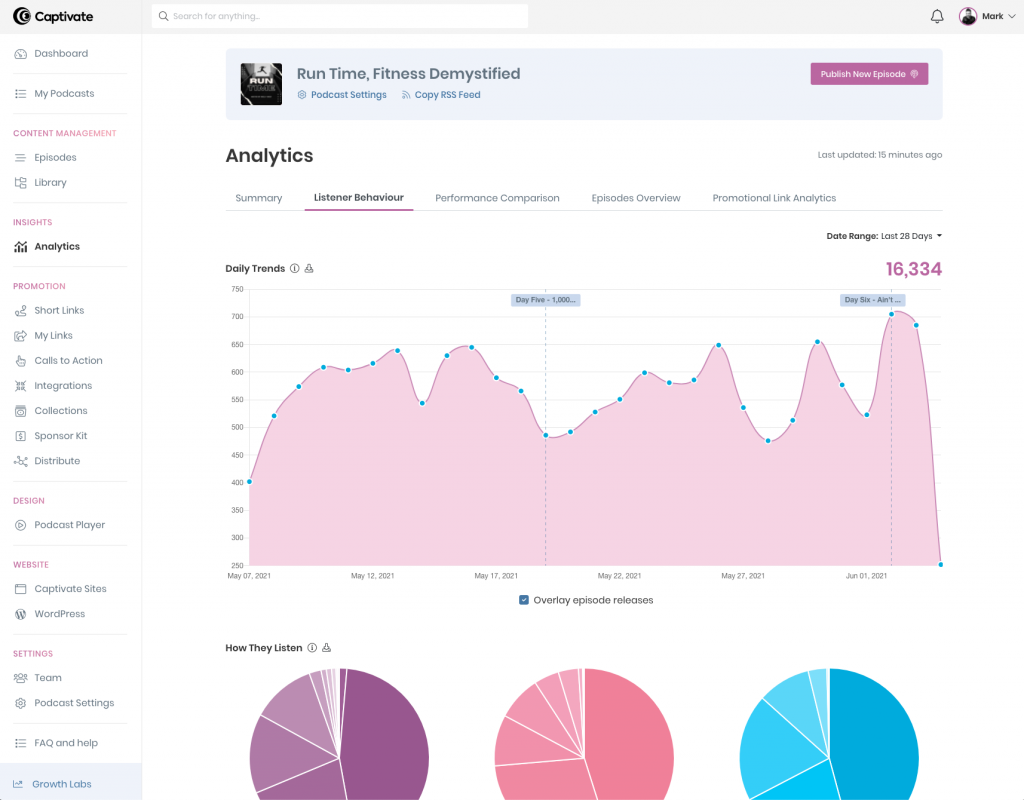
When you release a new episode, it’s always an anxious wait to see how many downloads it has or whether it’s been well received.
Your daily trend report allows you to drill down into the performance of your podcast episodes in granular detail. Switch between a daily or a cumulative view to easily identify peaks, troughs and download spikes.
With daily trends, you can see exactly how many downloads an episode received hour-to-hour on any given day, which is extremely useful if you’re launching a new podcast, a new season or bonus content.
If you’re trying out a new format or topic for example, you can use Daily Trends to closely measure how receptive your audience is to the changes and the impact they have or had on your downloads numbers.
How They Listen
Use this for: knowing how your listeners access your podcast
There are so many directories to submit to and access podcasts with. Apple might have the monopoly (at least for now), but it’s helpful to know where your listeners are getting your podcast from, to know where to focus your attention.
‘How They Listen’ shows the different devices, tools and operating systems your listeners are using to listen to your podcasts.
You can use these insights to tailor your marketing messaging and single subscription links to cater to your audience’s preferred methods of listening.
Another article we think you’d like...
Reading Time: 7 minutes It’s a crucial step in starting a podcast, so how do you come up with your podcast name? Learn how 5 podcasters came up with their names along with everything you need to know about choosing your own.
For example, our podcast, The Podcast Accelerator, is listened to mostly using:
- Apple Podcasts (58%)
- Overcast (9.1%)
- Other (7.6% – listening apps which don’t provide data).
We also know that our audience listens on mobile apps, the majority of which are – what a surprise – iOS. We could use that data to create tailored marketing that is accessible to phone users, like captioned video clips or audiograms, to keep those listeners listening.
On the other side of the coin, if we saw an increase in listeners using Chrome and desktop browsers, it would be worthwhile to work on our podcast website, provide transcriptions and up our podcast SEO efforts to boost discoverability and audience engagement.
Pro tip: for tons more easy, actionable marketing strategies to grow your podcast, check out our comprehensive How to Market Your Podcast tutorial!
Where They Listen
Use this for: knowing whereabouts your listeners are in the world
‘Where they listen’ shows you a world map and the different concentrations of listeners you have from country to country. Coupled with gender/age-group demographic data from Spotify and Google, you can start to make educated guesses about what kinds of groups the majority of your listeners fall into.
For example, a large concentration of listeners in the US and Canada would tell you to:
- Publish episodes and social media with those timezones in mind
- Be mindful of public holidays like Thanksgiving and Labour Day.
You could also look at tailoring your sponsorships or marketing towards that audience in order to increase engagement.
Demographic data such as this is incredibly useful when thinking about how to increase listener engagement, download numbers and what kind of monetization options might work best for your audience.
Armed with this data, you can start to tailor messaging, promotional content and advertising towards this audience to see if it increases your unique listeners or downloads over time.
Episode Comparison
Use this for: comparing the performance multiple episodes over time
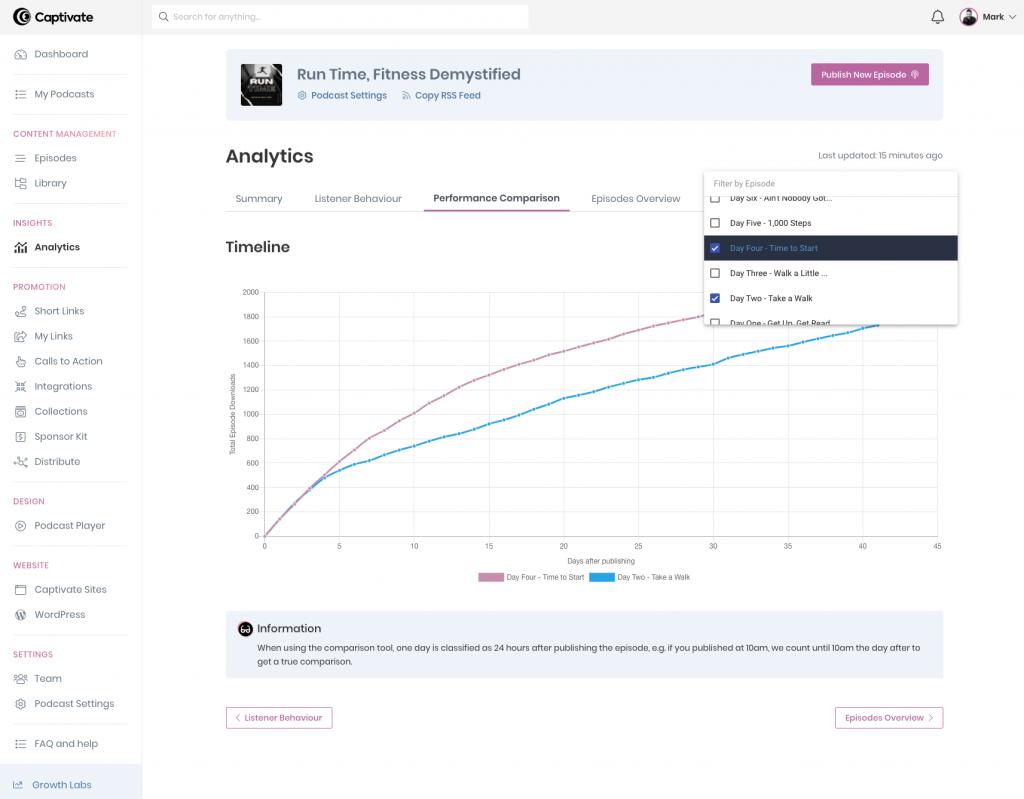
Being able to measure how your podcast episodes perform within the first couple of months of release is an important metric not only for calculating your reach but also for securing and maintaining podcast sponsorships.
When pitching to sponsors, you’ll want to be able to show them sustained download numbers and reach over time. That way, you can demonstrate that their sponsorship will be served to a steady stream of listeners for the duration of the campaign!
Episode comparison also helps you gain insights into the kinds of content and formats your audience is most receptive to, in an easy-to-understand, visual way.
For example, episodes trending upwards over time is an indication that your content is relevant, well promoted and that your audience size is growing.
On the other hand, if you see a consistent flattening out or slowing down of downloads around the 7 day mark, that’s an indication that your episodes aren’t being discovered or promoted effectively. You can then make moves to market your podcast and start growing your listener base.
Episode Overview
Use this for: keeping track of your most popular episodes
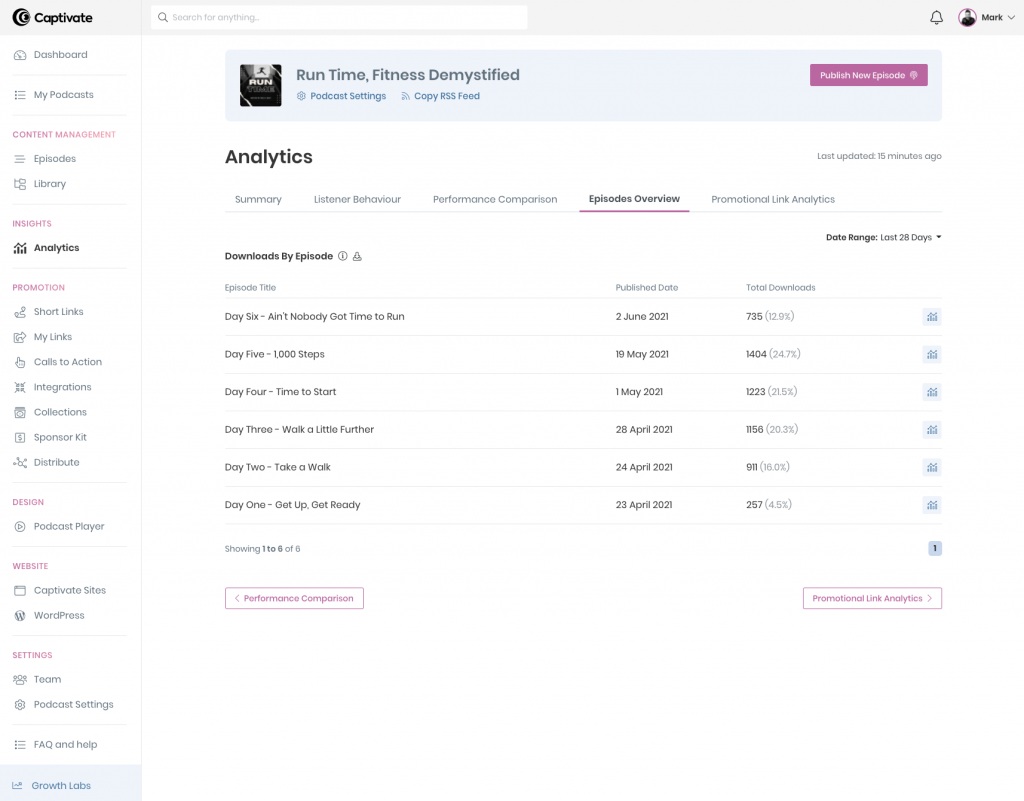
‘Episode overview’ shows you the total downloads per episode of your podcast within a given timeframe. It gives you a helpful snapshot of what kind of content is performing best . That means you can then plan more episodes around what your listeners find interesting.
Episode overview also gives you insight into how an individual episode is performing. Is one topic outperforming all the others? Is a particular season or batch of episodes continuing to gain downloads months after release? What was popular over the festive season?
For example, you might have pinned an episode, a trailer or a Curated Collection to your podcast website. How many total downloads that episode has achieved gives you an indication of how successful it’s been in attracting new listeners.
Promotional Link Analytics
Use this for: tracking the performance of your Single Subscription Link
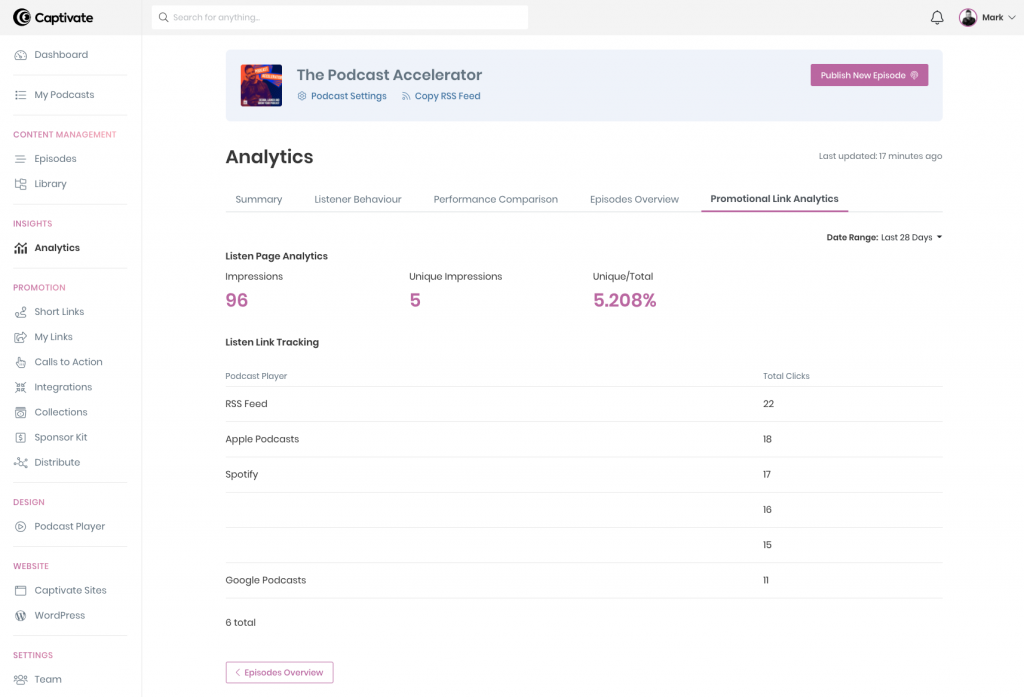
Your Single Subscription Page is a powerful tool for promoting your podcast. This tool displays listen page analytics and listen link tracking, so you can see how many listeners have landed on your page and what directory they clicked on.
‘Listen page analytics’ will show you:
- Impressions (how many repeat/return visits from the same person)
- Unique Impressions (how many individual listeners landed on your page)
- Unique clicks as a percentage of all clicks (of all your page clicks, how many were individuals)
‘Listen link tracking’ will show you each directory and how many times each button was clicked on.
This is extremely helpful for monitoring the success of your marketing and promotion outside of your podcast-related metrics, without the need to use third-party analytics.
Another article we think you’d like...
Reading Time: 6 minutes Your podcast description is often the driving force behind deciding to listen in for the first time. Here’s our blueprint for how to create a persuasive, effective show summary that converts browsers into fans!
With this data, you get visibility on how your single subscription link is performing, and where people are choosing to listen. On top of that, you can get more insights into the size and engagement levels of your audience.
You’ll also be able to use this data to determine which channels and messages had the greatest impact on the decision to listen into your podcast. With this information, you can do more of what moves the needle and work smarter, saving you time!
Recap: Why Are Podcast Stats and Analytics Important?
Without a good grasp of your podcast stats, you won’t be able to make informed decisions on how to best market, advertise and monetize your podcast.
Analytics, when combined with other performance measurement tactics – like reviews, feedback and social media engagement – will help you to draw a detailed picture of your audience, their behaviour, their preferred content and how that affects your podcast’s growth over time.
In this guide, we’ve taken you through everything you need to know about podcast analytics and how you can interpret and apply them to your show.
By measuring, testing, tweaking and analysing your podcast stats over time, you’ll be able to sustainably grow your listenership, subscribers and podcast brand in a way that suits you as well as your audience.
Get Free, IAB Certified Podcast Analytics Tools with Captivate
Captivate offers free, advanced podcast analytics from day one with no extra upgrades or hidden costs.
Get a no-obligation, free 30-day podcast hosting trial to start growing your podcast sustainably, with data-backed decisions, using the analytics dashboard. Easily build, promote and measure the performance of your podcast stats, listener engagement and interaction in one place!
If you have a question about our podcast analytics and how to interpret your stats, we live, breathe and sleep podcasting.
We’d love to offer you any support, guidance or advice that you need on growing your podcast or understanding your analytics. Just reach out to us @CaptivateAudio or leave us a support message here.
Here’s What To Read Next:
- Get more information on our Analytics dashboard with our detailed Overview guide.
- You can read more about our Episode-Level Podcast Analytics, too.
- Analytics and marketing strategy go hand-in-hand. Read our comprehensive guide on How to Market Your Podcast for Growth and Success, including 14 tactics and quick wins.
- Want to get started with sponsorships? Read our in-depth How To Make Money Podcasting guide. Or, get straight-talking advice from 4 industry experts on how best to pitch to sponsors!
[optin-monster-shortcode id=”cxdn9b49xvn7pzo1i2ck”]
